
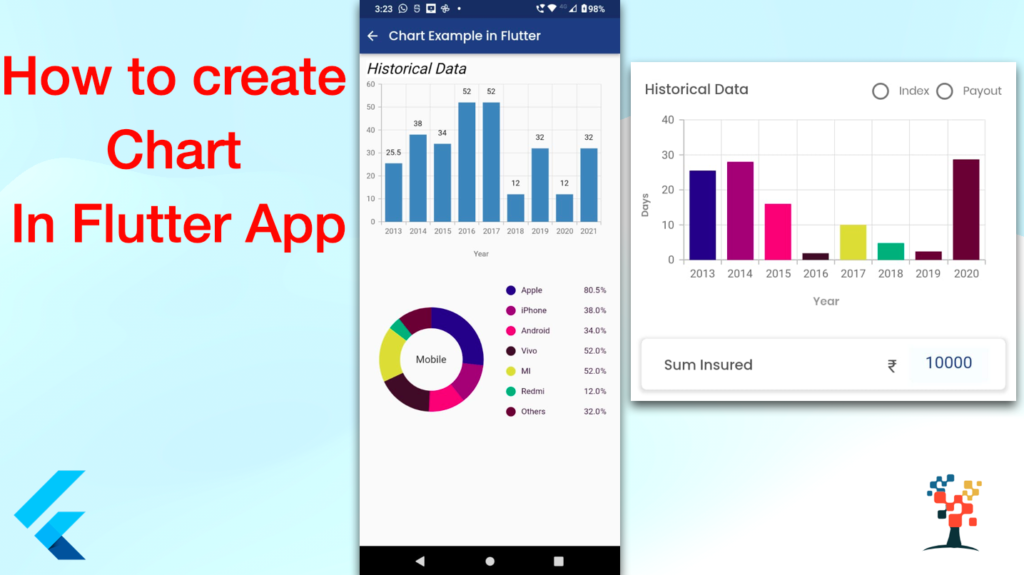
Hello developers, welcome back to my blog today, I am sharing a highly interesting article – how to create a chart in the flutter app in iOS/Android. This topic is highly needed by every app for data presentation for the user to show service with the help of the mobile app. So I am briefly describing this article for Chart integration on your flutter app.
This topic covers –
- Create a model chart object class in a flutter.
- How do you integrate with the Chart library in the flutter app?
- Beautiful, animated charts for Flutter.
- How do you implement a chart in Flutter?
- Are Syncfusion Flutter charts free?
- How do you use Syncfusion in Flutter?
- Do JSON responses bind the flutter chart?
- Integration – Chart with Example API?
Let’s Start intgration
Step No-1
Create a flutter app with help of the terminal you want to create an app with more help
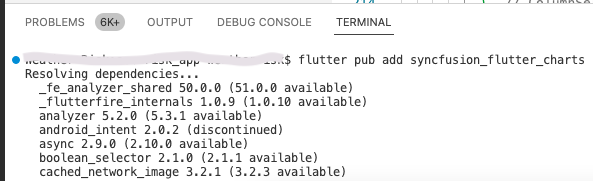
Install a pub library (pub. dev)
With the help of the syncfusion_flutter_charts pub library
Step 2
Create a chart model class
class ChartData {
ChartData(this.x, this.y, [this.color]);
final String mobile;
final double sale;
final Color? color;
}
class ChartDataInfo {
ChartDataInfo(this.year, this.value, [this.color]);
final String year;
final double value;
final Color? color;
}
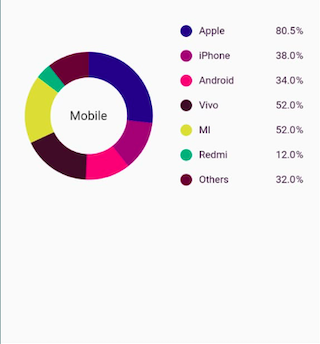
final List<ChartData> chartData = [
ChartData('Apple', 80.5, Color.fromRGBO(9, 0, 136, 1)),
ChartData('iPhone', 38, Color.fromRGBO(147, 0, 119, 1)),
ChartData('Android', 34, Color.fromRGBO(228, 0, 124, 1)),
ChartData('Vivo', 52, Color.fromARGB(255, 59, 19, 41)),
ChartData('MI', 52, Color.fromARGB(255, 223, 215, 67)),
ChartData('Redmi', 12, Color.fromARGB(255, 7, 170, 118)),
ChartData('Others', 32, Color.fromARGB(255, 96, 3, 54)),
];
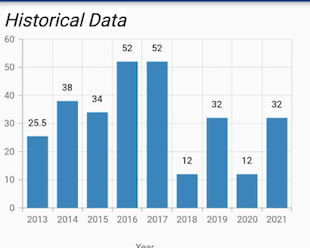
final List<ChartDataInfo> indexChart = [
ChartDataInfo('2013', 25.5, Color.fromRGBO(9, 0, 136, 1)),
ChartDataInfo('2014', 38, Color.fromRGBO(147, 0, 119, 1)),
ChartDataInfo('2015', 34, Color.fromRGBO(228, 0, 124, 1)),
ChartDataInfo('2016', 52, Color.fromARGB(255, 59, 19, 41)),
ChartDataInfo('2017', 52, Color.fromARGB(255, 223, 215, 67)),
ChartDataInfo('2018', 12, Color.fromARGB(255, 7, 170, 118)),
ChartDataInfo('2019', 32, Color.fromARGB(255, 96, 3, 54)),
ChartDataInfo('2020', 12, Color.fromARGB(255, 7, 170, 118)),
ChartDataInfo('2021', 32, Color.fromARGB(255, 96, 3, 54)),
];
Video example in chart display with android app.
Step 3
import chart library
import 'package:syncfusion_flutter_charts/charts.dart';Step 4
Create a UI screen
import 'package:flutter/material.dart';
import 'package:syncfusion_flutter_charts/charts.dart';
class MyChartExmaple extends StatelessWidget {
  @override
  Widget build(BuildContext context) {
    return Scaffold(
      appBar: AppBar(
        centerTitle: false,
        automaticallyImplyLeading: false,
        leadingWidth: 30,
        leading: IconButton(
          icon: const Icon(Icons.arrow_back, color: Colors.white),
          onPressed: () => Navigator.of(context).pop(),
        ),
        title: Text(
          'Chart Example in Flutter',
          overflow: TextOverflow.ellipsis,
          textAlign: TextAlign.left,
          style: TextStyle(
            color: Colors.white,
            fontFamily: 'Poppins',
            fontWeight: FontWeight.w500,
          ),
        ),
        backgroundColor: AppColors.headerColor,
      ),
      body: Column(
        mainAxisSize: MainAxisSize.min,
        crossAxisAlignment: CrossAxisAlignment.start,
        mainAxisAlignment: MainAxisAlignment.start,
        children: [
        circularChart(),

        Chart(),
         ],
      ),
    );
  }
Circular Chart
 Widget circularChart() {
    return Container(
        padding: EdgeInsets.fromLTRB(0, 0, 20, 0),
        child: SfCircularChart(
            legend: Legend(
                isVisible: true,
                width: "130",
                legendItemBuilder:
                    (String name, dynamic series, dynamic point, int index) {
                  return Container(
                    width: 174,
                    child: Row(
                      mainAxisAlignment: MainAxisAlignment.spaceBetween,
                      children: [
                        Row(
                          children: [
                            Container(
                              decoration: BoxDecoration(
                                  borderRadius: BorderRadius.circular(40),
                                  color: point.color),
                              height: 15,
                              width: 15,
                            ),
                            Padding(
                              padding: const EdgeInsets.fromLTRB(9.0, 8, 15, 9),
                              child: Text(
                                point.x.toString(),
                                style: const TextStyle(
                                    color: AppColors.textPolicyBlackColor,
                                    fontSize: 13,
                                    fontWeight: FontWeight.w500),
                                textAlign: TextAlign.left,
                              ),
                            ),
                          ],
                        ),
                        Padding(
                          padding: const EdgeInsets.fromLTRB(9.0, 8, 15, 9),
                          child: Row(
                            children: [
                              Text(
                                point.y.toString(),
                                style: TextStyle(
                                    color: AppColors.textPolicyBlackColor,
                                    fontSize: 13,
                                    fontWeight: FontWeight.w500),
                              ),
                              Text(
                                "%",
                                style: TextStyle(
                                    color: AppColors.textPolicyBlackColor,
                                    fontSize: 13,
                                    fontWeight: FontWeight.w500),
                              ),
                            ],
                          ),
                        ),
                      ],
                    ),
                  );
                }),
            series: <CircularSeries>[
              DoughnutSeries<ChartData, String>(
                  dataSource: chartData,
                  pointColorMapper: (ChartData data, _) => data.color,
                  xValueMapper: (ChartData data, _) => data.mobile,
                  yValueMapper: (ChartData data, _) => data.sale,
                  innerRadius: '55%'),
            ],
            annotations: <CircularChartAnnotation>[
              CircularChartAnnotation(
                widget: Container(
                    child: const Text(
                  'Mobile',
                  style: TextStyle(fontSize: 16, fontWeight: FontWeight.w500),
                )),
              )
            ]));
  }
}
ColumnSeries – chart
Widget Chart() {
  return Container(
      padding: EdgeInsets.fromLTRB(0, 0, 20, 0),
      child: SfCartesianChart(
        primaryXAxis: CategoryAxis(
          labelRotation: 0,
          labelIntersectAction: AxisLabelIntersectAction.multipleRows,
        ),
        title: ChartTitle(
            text: 'Historical Data',
            backgroundColor: Colors.white,
            borderColor: Colors.black,
            //  borderWidth: 1,
            // Aligns the chart title to left
            alignment: ChartAlignment.center,
            textStyle: const TextStyle(
              color: Colors.black,
              fontFamily: 'Roboto',
              fontStyle: FontStyle.normal,
              fontSize: 20,
            )),
        series: <ChartSeries>[
          // Renders line chart

          ColumnSeries<ChartDataInfo, String>(
            dataSource: indexChart,
            pointColorMapper: (ChartDataInfo data, _) => data.color,
            xValueMapper: (ChartDataInfo data, _) => data.year,
            yValueMapper: (ChartDataInfo data, _) => data.value,
            enableTooltip: true,
            dataLabelSettings: DataLabelSettings(
              isVisible: true,
              angle: 0,
            ),
          ),
        ],
      ));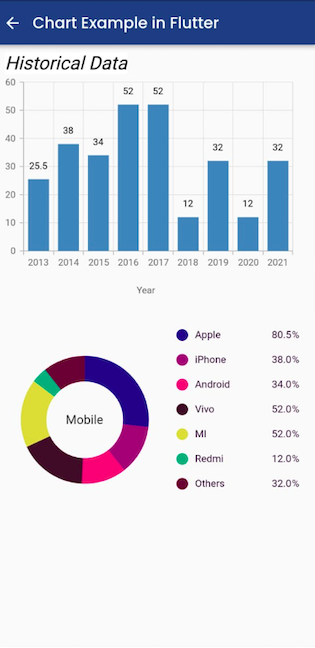
}Final UI and Complete code of the chart implementation in the flutter app.
import 'package:flutter/material.dart';
import 'package:my_app/utlity/colors.dart';
import 'package:syncfusion_flutter_charts/charts.dart';
class ChartData {
ChartData(this.mobile, this.sale, [this.color]);
final String mobile;
final double sale;
final Color? color;
}
class ChartDataInfo {
ChartDataInfo(this.year, this.value, [this.color]);
final String year;
final double value;
final Color? color;
}
final List<ChartData> chartData = [
ChartData('Apple', 80.5, Color.fromRGBO(9, 0, 136, 1)),
ChartData('iPhone', 38, Color.fromRGBO(147, 0, 119, 1)),
ChartData('Android', 34, Color.fromRGBO(228, 0, 124, 1)),
ChartData('Vivo', 52, Color.fromARGB(255, 59, 19, 41)),
ChartData('MI', 52, Color.fromARGB(255, 223, 215, 67)),
ChartData('Redmi', 12, Color.fromARGB(255, 7, 170, 118)),
ChartData('Others', 32, Color.fromARGB(255, 96, 3, 54)),
];
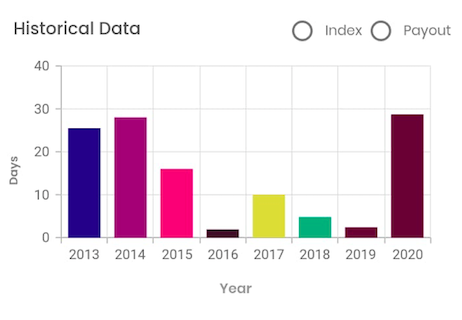
final List<ChartDataInfo> indexChart = [
ChartDataInfo('2013', 25.5, Color.fromRGBO(9, 0, 136, 1)),
ChartDataInfo('2014', 38, Color.fromRGBO(147, 0, 119, 1)),
ChartDataInfo('2015', 34, Color.fromRGBO(228, 0, 124, 1)),
ChartDataInfo('2016', 52, Color.fromARGB(255, 59, 19, 41)),
ChartDataInfo('2017', 52, Color.fromARGB(255, 223, 215, 67)),
ChartDataInfo('2018', 12, Color.fromARGB(255, 7, 170, 118)),
ChartDataInfo('2019', 32, Color.fromARGB(255, 96, 3, 54)),
ChartDataInfo('2020', 12, Color.fromARGB(255, 7, 170, 118)),
ChartDataInfo('2021', 32, Color.fromARGB(255, 96, 3, 54)),
];
class MyChartExmaple extends StatelessWidget {
@override
Widget build(BuildContext context) {
return Scaffold(
appBar: AppBar(
centerTitle: false,
automaticallyImplyLeading: false,
leadingWidth: 30,
leading: IconButton(
icon: const Icon(Icons.arrow_back, color: Colors.white),
onPressed: () => Navigator.of(context).pop(),
),
title: Text(
'Chart Example in Flutter',
overflow: TextOverflow.ellipsis,
textAlign: TextAlign.left,
style: TextStyle(
color: Colors.white,
fontFamily: 'Poppins',
fontWeight: FontWeight.w500,
),
),
backgroundColor: AppColors.headerColor,
),
body: Column(
mainAxisSize: MainAxisSize.min,
crossAxisAlignment: CrossAxisAlignment.start,
mainAxisAlignment: MainAxisAlignment.start,
children: [
Chart(),
Padding(
padding: const EdgeInsets.only(left: 180, right: 150, top: 10),
child: Text(
"Year",
overflow: TextOverflow.ellipsis,
textAlign: TextAlign.center,
style: TextStyle(
color: Colors.grey.shade700,
fontSize: 12,
),
),
),
Divider(
color: Colors.blue,
),
SizedBox(
height: 30,
),
circularChart(),
],
),
);
}
Widget circularChart() {
return Container(
padding: EdgeInsets.fromLTRB(0, 0, 20, 0),
child: SfCircularChart(
legend: Legend(
isVisible: true,
width: "130",
legendItemBuilder:
(String name, dynamic series, dynamic point, int index) {
return Container(
width: 174,
child: Row(
mainAxisAlignment: MainAxisAlignment.spaceBetween,
children: [
Row(
children: [
Container(
decoration: BoxDecoration(
borderRadius: BorderRadius.circular(40),
color: point.color),
height: 15,
width: 15,
),
Padding(
padding: const EdgeInsets.fromLTRB(9.0, 8, 15, 9),
child: Text(
point.x.toString(),
style: const TextStyle(
color: AppColors.textPolicyBlackColor,
fontSize: 13,
fontWeight: FontWeight.w500),
textAlign: TextAlign.left,
),
),
],
),
Padding(
padding: const EdgeInsets.fromLTRB(9.0, 8, 15, 9),
child: Row(
children: [
Text(
point.y.toString(),
style: TextStyle(
color: AppColors.textPolicyBlackColor,
fontSize: 13,
fontWeight: FontWeight.w500),
),
Text(
"%",
style: TextStyle(
color: AppColors.textPolicyBlackColor,
fontSize: 13,
fontWeight: FontWeight.w500),
),
],
),
),
],
),
);
}),
series: <CircularSeries>[
DoughnutSeries<ChartData, String>(
dataSource: chartData,
pointColorMapper: (ChartData data, _) => data.color,
xValueMapper: (ChartData data, _) => data.mobile,
yValueMapper: (ChartData data, _) => data.sale,
innerRadius: '55%'),
],
annotations: <CircularChartAnnotation>[
CircularChartAnnotation(
widget: Container(
child: const Text(
'Mobile',
style: TextStyle(fontSize: 16, fontWeight: FontWeight.w500),
)),
)
]));
}
}
Widget Chart() {
return Container(
padding: EdgeInsets.fromLTRB(0, 0, 20, 0),
child: SfCartesianChart(
primaryXAxis: CategoryAxis(
labelRotation: 0,
labelIntersectAction: AxisLabelIntersectAction.multipleRows,
),
title: ChartTitle(
text: 'Historical Data',
backgroundColor: Colors.white,
borderColor: Colors.black,
// borderWidth: 1,
// Aligns the chart title to left
alignment: ChartAlignment.center,
textStyle: const TextStyle(
color: Colors.black,
fontFamily: 'Roboto',
fontStyle: FontStyle.normal,
fontSize: 20,
)),
series: <ChartSeries>[
// Renders line chart
ColumnSeries<ChartDataInfo, String>(
dataSource: indexChart,
pointColorMapper: (ChartDataInfo data, _) => data.color,
xValueMapper: (ChartDataInfo data, _) => data.year,
yValueMapper: (ChartDataInfo data, _) => data.value,
enableTooltip: true,
dataLabelSettings: DataLabelSettings(
isVisible: true,
angle: 0,
),
),
],
));
}
I hope it was a useful article, please share and subscribe to my channel, You have enjoyed the most. Thanks for reading and if you have any questions or comments, See you soon.

