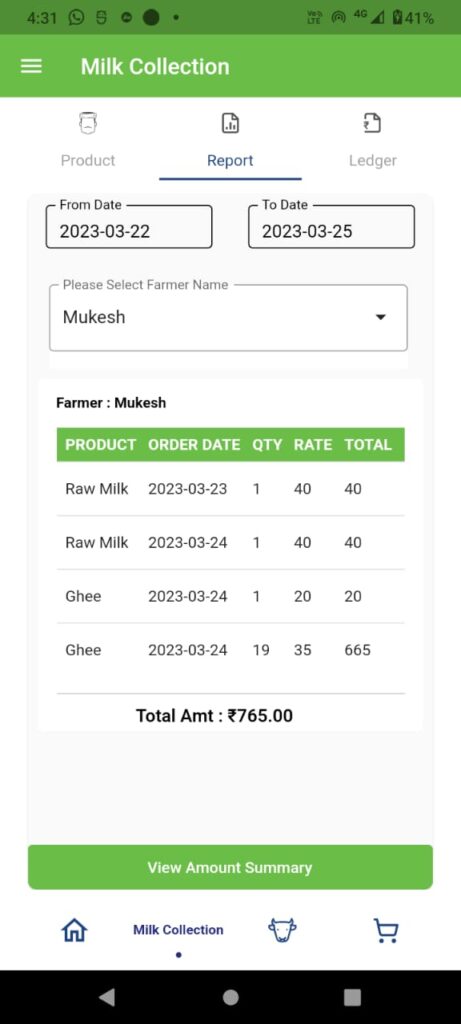
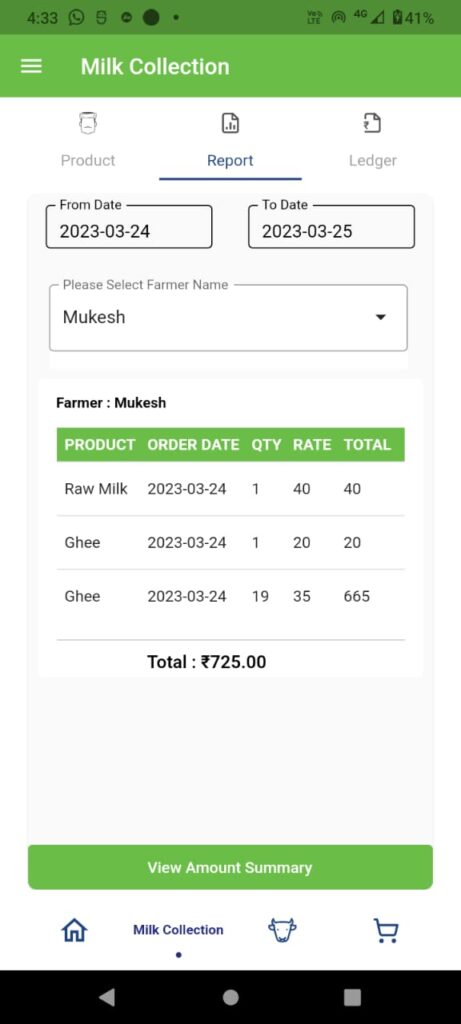
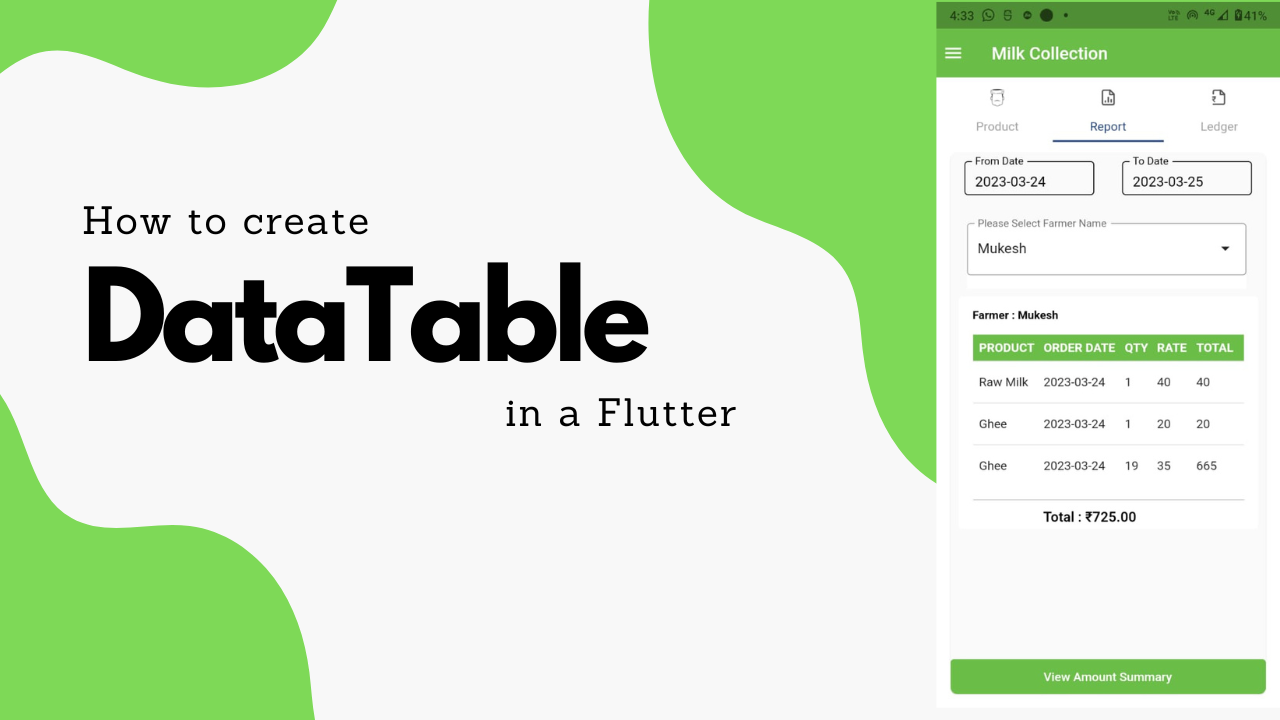
In Flutter, DataTable is a commonly used widget in Flutter for displaying tabular data, and it is often used in conjunction with other widgets such as ListView or GridView to create complex data-driven user interfaces.
This widget displays data in a tabular format with rows and columns. It is similar to the HTML table tag in web development.


To create a DataTable widget in Flutter, you can use the DataTable class, which requires the following parameters:
- columns: a list of DataColumn widgets that define the column headers for the table.
- rows: a list of DataRow widgets that define the data for each row in the table.
- data cell: which contains the information for a solitary cell in the information table.
- onTap: an optional callback function that is called when the user clicks the row.
This article has covered data table relate queries. Please see below.
- flutter DataTable example?
- flutter DataTable fixed header?
- flutter DataTable fixed column width?
- flutter DataTable border?
- flutter DataTable horizontal scroll?
- flutter DataTable binding data?
- flutter DataTable from API?
- row and column in flutter?
- DataTable class – material library
Code block
  SingleChildScrollView _dataBody() {
    // Both Vertical and Horozontal Scrollview for the DataTable to
    // scroll both Vertical and Horizontal asper your need
    return SingleChildScrollView(
      scrollDirection: Axis.vertical,
      child: SingleChildScrollView(
        scrollDirection: Axis.horizontal,
        child: Padding(
          padding: const EdgeInsets.only(right: 10.0, top: 15.0),
          child: DataTable(
            columnSpacing: 10,
            headingRowHeight: 30,
            headingTextStyle: const TextStyle(
                fontWeight: FontWeight.bold,
                fontSize: 14.0,
                letterSpacing: 0.0,
                color: Colors.white),
            headingRowColor: MaterialStateColor.resolveWith(
              (states) => AppTheme.mainColor,
            ),
            columns: const [
              DataColumn(
                label: Text('PRODUCT'),
              ),
              DataColumn(
                label: Text('ORDER DATE'),
              ),
              DataColumn(
                label: Text('QTY'),
              ),
              DataColumn(
                label: Text('RATE'),
              ),
              DataColumn(
                label: Text('TOTAL'),
              ),
            ],
            rows: _requestMilkListTemp
                .map(
                  (milkReport) => DataRow(cells: [
                    //(TYPE)
                    DataCell(
                      Text(milkReport.milkName!),
                    ),
                    DataCell(
                      Text(milkReport.orderDate!),
                    ),
                    DataCell(
                      //(BREED)
                      Text(
                        milkReport.amount!,
                      ),
                      onTap: () {},
                    ),

                    DataCell(
                      Text(
                        milkReport.milkRate!,
                      ),
                      onTap: () {
                        //your action
                      },
                    ),
                    DataCell(
                      Text(
                          "${int.parse(milkReport.amount!) * int.parse(milkReport.milkRate!)} "),
                      onTap: () {
                        //your acction
                      },
                    ),
                  ]),
                )
                .toList(),
          ),
        ),
      ),
    );
  }
1-Fixed header : headingRowHeight: 30
2-Horizontal scroll : scrollDirection: Axis.horizontal
have used the calculation of the value – qty and amount multiplication and total amount how to show at bottom of the data table below.
I hope this is helpful for your current and next projects are very.
keep smiling and work smart!


